The text below contains only a few data points to show the scope of the Russian Oil and Gas business. Please note that the graphs below are for illustration only and are not updated regularly.
Detailed data on some topics from listed below is available in the Russia Upstream and Oilfield Services 2019 report (click here to see details)
Detailed data on some topics from listed below is available in the Russia Upstream and Oilfield Services 2019 report (click here to see details)
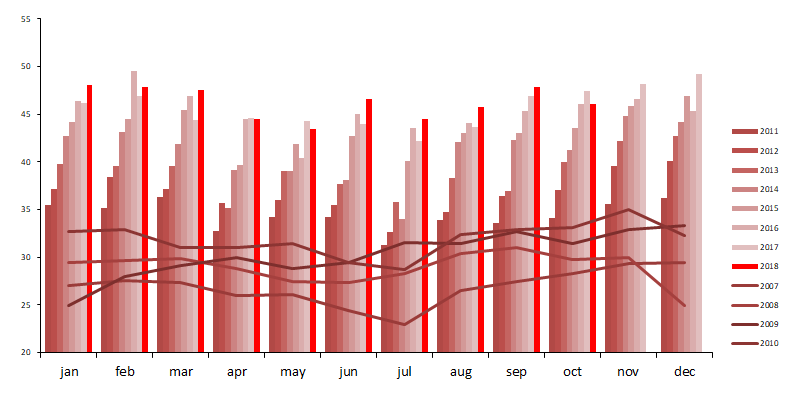
Crude and Condensate Production in Russia
Russian crude oil and condensate production grew to almost 556 million tons (standard Russian accounting for oil/condensate production) in 2018. The OPEC+ deal in June was relaxed and Russia pushed production up in the following months of the year. Crude and condensate production was flat in 2017 at just below 547 million tons. Crude and condensate production in Russia grew 2.5% in 2016 to 547.5 million tons. The growth in September 2016 was delivered by new projects in YaNAD and continued growth in East Siberia.
Figure. Daily crude oil production in Russia in January 2007- September 2018 (thousand tons a day)
Figure. Daily crude oil production in Russia in January 2007- September 2018 (thousand tons a day)
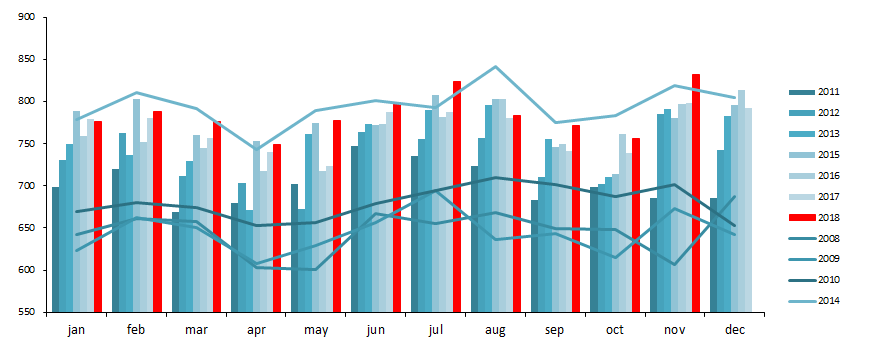
Natural and Associated Petroleum Gas Production in Russia
Natural and petroleum gas production grew to 741 bcm in 2018. In 2017 total production grew by 7.9%. Domestic market continued to be weak with all gains coming from record export to Europe.
Gas production was up 1% in 2016 to 652 bcm from 646 bcm in 2015 while Gazprom production remained almost flat.
Officials reported 1% decline in gas production in Russia in 2015 to 635 bcm from 640 bcm in 2014 (excluding flaring which is included in numbers in paragraphs below). This reported decline was very moderate considering lower production levels in the first nine months of the year, unusually warm weather in the last quarter, hectic supplies to Ukraine and poor economic conditions of the Russian economy. This report suggested that Russian gas producers delivered in the 4th quarter 10 billion cubic meters more than in the 4th quarter 2014 - approximately the same volume as export losses to Europe in the 4th quarter of 2014 due to Gazprom's restrictions on export in an effort to halt reverse supplies to Ukraine.
Figure. Gas production in Russia in January 2007 - September 2018 (mcm a day)
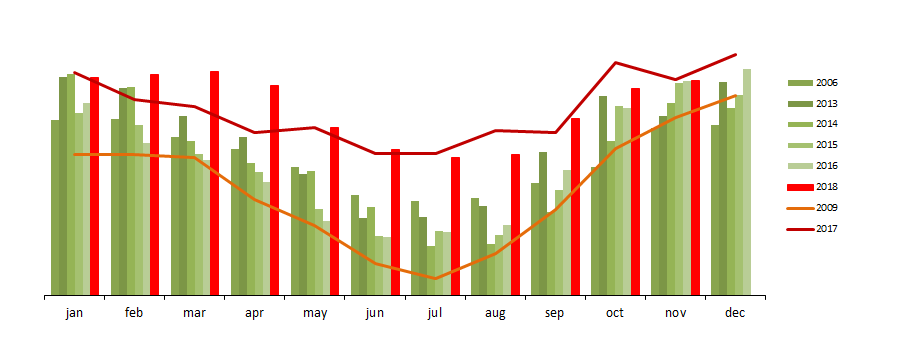
Russian Refinery throughput
Russian refinery throughput grew to 287 million tons 2018. Throughput remained almost flat in 2017, after it was down 1.1% in 2016 to 280 million tons.
In 2015, the refinery throughput in Russia declined for the first time since 2009 (-2.5%). The refinery throughput growth consistently exceeded crude and condensate production from 2005 (3.1% p.a. in 2005-2015 vs 1.2% p.a. for crude). The refinery throughput in Russia increased to 290 million tons in 2014 (up 5.3%). The growth rate in 2013 declined to 3% from average 5% in 2010-2012. The refinery throughput grew 4% in 2012 to 268 million tons (5.36 mmbd).
Growth stalled in 2015, but there were no signs of major impact from the introduction of a so-called "Big Maneuver" (changes in export taxation of crude and petroleum products vs MET). Crude oil export duty freeze for 2016 at 2015 level (it was suppose to go down) reduces potential impact of the "big maneuver" on refinery throughput in 2016.
If the first four months of 2016 were an indication of the future then 5% decline in 2016 is possible (daily throughput was 4.2% lower then the first four months of 2015).
Figure. Refinery throughput in Russia in January 2008 - October 2018 (thousand tons a day in a month)
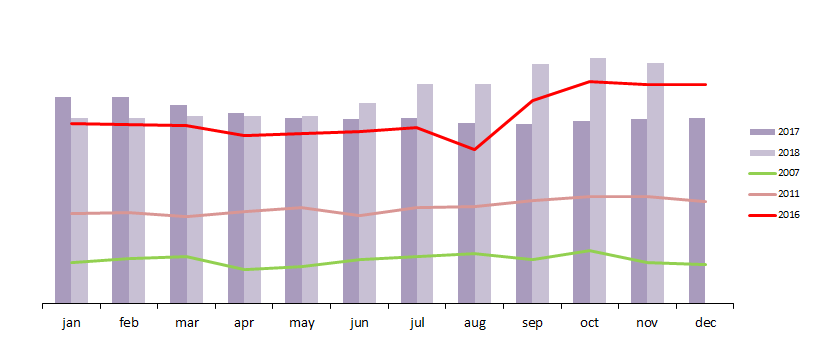
Liquefied Petroleum Gases
LPG production reached 17 million tons in 2018. It grew by just 0.8% in 2017 despite growth in gas production. LPG production grew 4.3% in 2016 as increased condensate production offset declines at refineries.
LPG production in Russia in 2015 was up 6% from 2014 amid slightly declining refining throughput volumes.
Production of LPG in Russia grew by 5% in 2014 – the growth was below 6% growth in 2013. The growth was supported by increased utilization of petroleum gas, growth in condensate production and gains in refinery throughput.
Figure. LPG production in Russia in January 2007 - October 2018 (thousand tons a day in a month)